At the World Championships in Dortmund last year, ISU president Cinquanta proudly proclaimed that with the new judging system, never again would the skaters and the public be able to criticize the judges for their marks.
How wrong he was.
The recent European Championships were widely criticized for the results in the ladies and ice dancing events. The ISU responded by issuing a press released that basically said "It's all good." According to this press release, everyone is happy with the system. There are no complaints. And all that is needed is just a little more continuing education for the judges to make a perfect system even more perfect.
Excuse me? Were the sources of this press release watching the same coverage, reading the same reports, surfing the same internet as the rest of us? In the ladies event, many expressed the view that Irina Slutskaya was shamelessly held up in the program components to win, and others that review of video from the free skating shows that Julia Sebestyen was robbed of 4.5 points, and the silver medal, due to an error by the callers in designating a poor triple Lutz a double. These criticisms were expressed not just by fans (who were burning up the internet worldwide), but also by former champions and ISU judges. No complaints? Not!
Contrary to the head-in-the-sand view from the ISU, it's not all good. Regardless of whether Slutskaya was actually held up or not, the reactions to Europeans make clear that the ISU still has serious credibility problems, that more and more people recognize that the judging system does not prevent judges from holding up (or pushing down) skaters if they feel like it, and that the possibility of "protocol" judging is not eliminated by the judging system. Increasingly, people recognize that the callers can make mistakes that can affect the podium, and that their decisions are indeed part subjective judgments open to question (such as whether a jump is truly cheated, or a spin position held long enough to count, etc.).
Given all this controversy, it seemed like it might be interesting (at least to a geek) to look at the scores from the ladies event and see what they might tell us about the event and the judging process. That is what we did, and this is what we found.
Before even beginning the calculations one thing was immediately noticed. In the ladies event there were two cases of judges entering the wrong scores (identified by entering marks of less than one). Elena Liashenko was a victim of this in the free skating, and to Jaqueline Belenyesiova in the short program. This error also occurred in other events at Europeans. One can only guess how many other marks are slightly off due to entry errors, since only the marks of less than one glaringly stand out, but it is reasonable to expect there are some.
For Liashenko, the eighth set of marks in the free skating protocol have an entry error. Marks from columns 3, 5, and 7 were the discard marks, so the marks from column 8 were part of the results. Due to the entry error, Liashenko lost 0.06 points. Not many points 0.06, and it didn't affect the medal result this time; but if this defect of the system is not corrected eventually an entry error like this will affect a medal result, at which point there will no doubt be hell to pay. But the ISU stubbornly refuses to add the simple "idiot check" that any competent programmer or system engineer would include in the user interface.
The following is the order of finish for the top six skaters. For comparison we also show the Total Factored Place using the former method for combining short and long program results.
| Place | Skater | SP Points | SP Place | FS Points | FS Place | Total Points | TFP |
| 1 | Slutskaya | 65.02 | 1 | 103.69 | 1 | 168.71 | 1.5 |
| 2 | Poykio | 56.63 | 3 | 102.30 | 3 | 158.93 | 4.5 |
| 3 | Liashenko | 55.16 | 4 | 102.86 | 2 | 158.02 | 4.0 |
| 4 | Sebestyen | 61.28 | 2 | 95.85 | 6 | 157.13 | 7.0 |
| 5 | Sokolova | 52.46 | 5 | 98.42 | 4 | 150.88 | 6.5 |
| 6 | Maniachenko | 49.62 | 6 | 96.24 | 5 | 145.86 | 8.0 |
Since the system does not have the mathematical ability to distinguish between closely scored skaters, any skaters within about 1.5 points of each other are statistically tied. The order of finish for the long program in this event is statistically meaningless for the top three ladies. They are effectively tied. The final placements for Poykio and Liashenko are also statistically meaningless, (since the system does not have the mathematical fidelity to truly distinguish between results that differ by only 0.91 points) as are the places for many of the other skaters. A calculation of the statistical uncertainty in the total scores for this event shows that 14 of 37 places (39%) are not statistically significant -- meaning 14 skaters were effectively tied with another in this event.
Note also in the above table, that a 4.5 point error in Sebestyen's score moves her up to second place overall, and the silver medal. The correctness of one decision of the callers has a profound effect on the results in this event. Given the mathematical properties of the system it was previously predicted that the incorrect identification of a double vs. triple would typically move a skater one to two places in the results. In this event it proved to be two places.
The distribution of GoEs in the scoring is another area that came into criticism after Europeans. The dearth of GoEs of +2 and +3 is obvious from simple inspection of the protocols. The following table gives the detailed distribution of the GoEs for the ladies short and long programs.
DISTRIBUTION OF GoEs FOR 2005 EUROPEAN CHAMPIONSHIPS LADIES EVENT
| -3 | -2 | -1 | 0 | +1 | +2 | +3 | |
| SP | 436 | 136 | 451 | 2308 | 624 | 40 | 1 |
| FS | 276 | 197 | 508 | 2532 | 488 | 18 | 1 |
| Total | 712 | 333 | 959 | 4840 | 1112 | 58 | 2 |
| Percent | 8.9 | 4.2 | 12.0 | 60.4 | 13.9 | 0.7 | 0.02 |
| Percent (excluding -3) |
-- | 4.6 | 13.1 | 66.3 | 15.2 | 0.8 | 0.03 |
Out of 8016 GoEs, 85% lie in the range -1 through +1, and most of those (2/3) are 0s. GoEs of +2 and +3 are virtually non-existent (less than 1%).
This distribution of marks strains credibility. These are among the best skaters in the World, only a few of the top ladies are missing, and no one can do an element better than +1! Hard to believe.
Using triple jumps as an example, a GoE of +1 gives a skater about 20% more points than the base value for the average triple jump. That would seem to say that a +1 GoE should correspond to a jump that is only 20% better than "just ok." One would think that an element only 20% better than just ok would occur more than 14% of the time. Similarly, a GoE of +2 is only about 40% above the base value. One would think that an element only 40% better than just ok would occur more than 0.7% of the time. But that is not the way the marks are assigned.
It appears there is a major disconnect between the judging standard and the actual points to be won. It is as though in the decathlon the top points for the pole vault were set for a vault of 40 feet, knowing full well the best an athlete can do is about 20 feet. The points are out there to be earned, but no one is ever going to earn them.
So, what then is the point in having a GoE of +3 if the judges are never going to use it? Or even +2 for that matter?
The standards for the top GoEs make no sense from a practical point of view. It is suggested that the standard for a +3 GoE should be revised so that the top 1-2% of the executed elements have a chance of earning that score, with 4-5% for +2 and no more than 50% for 0. This way, the standard is tied to the actual range of skill for each element as they are performed today, not some abstract standard the skaters will never reach.
The fact the GoEs are not realistically spread out is one of the reasons the judging system has such a hard time mathematically separating nearly equivalent performances. In any evaluation process, the quality of the evaluation comes down to what (in science and engineering) is known as the signal-to-noise ratio. To get a good evaluation you want a big signal and low noise. Restricting the range of the GoEs so unnaturally decreases the signal, while decreasing the number of judges (by randomly throwing away judges) increases the noise (uncertainty). The worst of both worlds.
To improve the quality of competition results the system needs to increase the signal (spread out the marks) and reduce the noise (eliminate random selection of marks). Without some action along these lines, one can expect that 1/3 or more of the places in competition will continue to be statistically meaningless.
And who cares if the results are statistically meaningless? The skaters, one would hope; for the more statistically meaningless the results, the more likely random selection of the judges will skew the results away from the true opinion of the panel as a whole, and contaminate the results and the medal decision.
One can go a step farther in studying the GoEs and look at their distribution for individual elements. For example, how did the judges score all the double Axels in the ladies event?
Double Axels were scored 33 times in the Short Program and 18 times in the Free Skating The following table gives the distribution of GoEs for the two programs, and the percentage of the time each GoE was given.
DISTRIBUTION OF GoEs FOR DOUBLE AXELS
| -3 | -2 | -1 | 0 | +1 | +2 | +3 | |
| SP | 24 6.1% |
2 0.5% |
58 14.6% |
244 61.6% |
68 17.2% |
0 0.0% |
0 0.0% |
| FS | 12 5.6% |
0 0.0% |
25 11.6% |
161 74.5% |
18 8.3% |
0 0.0% |
0 0.0% |
Amazing! The best skaters in the world and no one can do a +2 or +3 double
Axel. No one!
Well maybe a double Axel is too difficult a jump, after all they have only been doing that jump since they were about 12 years old. Let's look at something really easy, like a level 1 straight line step sequence. No difficulty to this element required at all. The following table is the distribution of GoEs for the two programs, with this element scored 15 times in the Short Program and 12 times in the Free Skating.
DISTRIBUTION OF GoEs FOR STRAIGHT LINE STEP SEQUENCE LEVEL 1
| -3 | -2 | -1 | 0 | +1 | +2 | +3 | |
| SP | 0 0.0% |
1 0.6% |
20 11.1% |
141 78.3% |
18 10.0% |
0 0.0% |
0 0.0% |
| FS | 0 0.0% |
0 0.0% |
11 7.6% |
121 84.0% |
12 8.3% |
0 0.0% |
0 0.0% |
Amazing! The best skaters in the world and no one can do the simplest
straight line step sequence with +2 or +3 skill. No one! Only 9% of
the time do they even reach +1. A level 1 step sequence only requires
three-turns, mohawks, progressives and chasses. Steps they learned as babies,
and no one can do them better than +1.
This trend follows for EVERY element, no matter how simple. The best skaters in the world, and they are all such incompetent klutzes no one can do anything better than +1. Or perhaps the the problem lies elsewhere. Perhaps it is the construction of the system that leaves something to be desired.
This analysis also illustrates another problem in the judging of elements. The following table gives all the GoEs for the 15 straight line step sequence in the Short Program
GoEs FOR STRAIGHT LINE STEP SEQUENCE LEVEL 1, LADIES SHORT PROGRAM
|
J1 |
J2 |
J3 |
J4 |
J5 |
J6 |
J7 |
J8 |
J9 |
J10 |
J11 |
J12 |
|
0 |
1 |
0 |
1 |
1 |
1 |
0 |
1 |
0 |
0 |
0 |
0 |
|
0 |
0 |
0 |
0 |
0 |
0 |
1 |
0 |
0 |
0 |
0 |
0 |
|
0 |
0 |
0 |
0 |
0 |
1 |
0 |
0 |
0 |
0 |
0 |
1 |
|
0 |
1 |
0 |
0 |
1 |
1 |
0 |
0 |
0 |
1 |
0 |
1 |
|
0 |
0 |
0 |
0 |
0 |
1 |
0 |
0 |
0 |
1 |
0 |
0 |
|
0 |
0 |
0 |
0 |
0 |
1 |
0 |
1 |
1 |
0 |
0 |
0 |
|
0 |
0 |
0 |
0 |
0 |
0 |
0 |
0 |
0 |
0 |
0 |
0 |
|
0 |
0 |
0 |
0 |
0 |
0 |
0 |
0 |
0 |
-1 |
0 |
0 |
|
0 |
0 |
0 |
0 |
0 |
0 |
0 |
0 |
0 |
0 |
0 |
0 |
|
0 |
0 |
-1 |
0 |
-2 |
0 |
-1 |
-1 |
-1 |
-1 |
-1 |
0 |
|
0 |
0 |
0 |
0 |
0 |
0 |
0 |
0 |
-1 |
-1 |
0 |
0 |
|
0 |
0 |
0 |
0 |
0 |
-1 |
0 |
0 |
-1 |
0 |
0 |
0 |
|
0 |
0 |
-1 |
-1 |
-1 |
-1 |
0 |
-1 |
0 |
-1 |
-1 |
0 |
|
0 |
0 |
0 |
-1 |
0 |
0 |
0 |
0 |
-1 |
0 |
0 |
0 |
|
0 |
0 |
0 |
0 |
0 |
0 |
0 |
0 |
0 |
0 |
0 |
0 |
Fifteen different step sequences and judge 1 thought every one was the same! Not one was better or worse than the others. They were all just ok. For six other judges 13 of 15 sequences were marked identical. Only five of the 12 sets of marks move the skaters around, and then only to a limited extent.
Are the judges actually judging, or simply enjoying the best seats in the arena? Or is there something amiss with the system? In any event, this characteristic of the marks strains credibility. This characteristic of the marks is also found in the other events and in other competitions. In some Junior Grand Prix events, for example, some judges marked every step sequence with the same GoE of 0. That is not judging. That is seat warming.
One final problem associated with this characteristic of the marking is that it negates the expectation that something less difficult well done would earn more points than something more difficult poorly done. In principle, the point model allows that a well done double Lutz, for example, will earn more points than a poorly done triple Lutz. But if the judges never rate the double Lutz +2 or +3 it isn't going to happen.
Another areas where the marks at Europeans came up for "discussion" was the lack of spread in the marks for Program Components. This is a well know characteristic of the marks since the system was first developed. The following table shows the span of marks for Program Components 3, 4 and 5.
DISTRIBUTION OF RANGE OF PROGRAM COMPONENTS 3 -5
| 0.00 | 0.25 | 0.50 | 0.75 | 1.00 | > 1.00 | |
| SP | 96 21.6% |
282 63.5% |
57 12.8% |
8 1.8% |
0 0.0% |
1 0.2% |
| FS | 63 21.9% |
177 61.5% |
43 14.9% |
3 1.0% |
1 0.3% |
1 0.3% |
About 1/5 of the time the judges give the exact same mark for all three
components. Over 91% of the time, the marks had a spread of only 0.50,
corresponding to a range of plus/minus 0.25 about the average mark. The
two large values (>1.00) are actually due to entry errors and not a judge's
attempt to spread out their marks.
The spread in the marks for Program Components 1 and 2 is somewhat greater due to one characteristic of the Transitions mark. This mark is frequently different from the other Program Components, but this is not actually due to any greater spreading out of the marks.
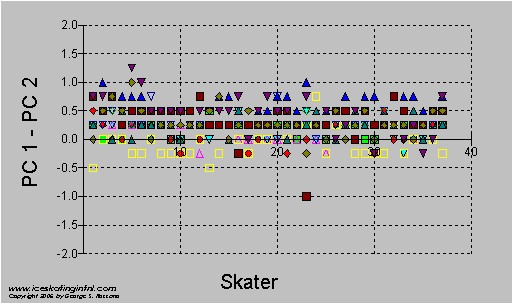
The following graph shows the difference between the marks for Skating Skills and Transitions for the ladies Short Programs.
What this graph shows is that the marks for Transitions average 0.25 less than the marks for Skating Skills, but that the spread of the Transitions marks is still just plus/minus 0.25 with respect to the average. The marks for Transitions track with all the other program components with just an added offset (shift) of 0.25 points. Note also that the band of symbols is equally wide in the graph from left side of the graph to the right. That means for the best skaters, the worst skaters and the middle skaters, their Skating Skills and Transitions were rated nearly equivalent in all case.
By inter-comparing all the Program Components, one finds that all five marks track together, with little spread in the marks. The only difference between the five marks is the offset in the Transitions mark. As we have written elsewhere, the idea that every skater performs every Program Component skill equally well is absurd, and we view this as a defect in the system.
Although ordinals are not calculated in the new judging system, they remain a useful tool for analysis of the judging process and the results. Some examples follow.
There are two things to notice in the following table. First, the order of finish based on all skills (using all judges) does not follow the official order of finish in four cases. These are the cases where random selection of the judges has contaminated the results. Second, the rankings for jumps, spins and sequences show considerable variety for most skaters. The system does reasonably well in distinguishing between these skill categories, and they are clearly being judged independently. For PC 1-2 and PC 3-5, however, the rankings show very little variation. Each skater was ranked in these two skills categories in basically the same order. This is another symptom of the failure to use the Program Components independently.
RANKING IN SKILL CATEGORIES FOR LADIES FREE SKATING
| Official Order of Finish |
All Skills |
Jumps |
Spins |
Sequences |
PC 1-2 |
PC 3-5 |
|
SLUTSKAYA Irina |
1 |
9 |
1 |
3 |
1 |
1 |
|
LIASHENKO Elena |
2 |
1 |
5 |
2 |
5 |
5 |
|
POYKIO Susanna |
3 |
2 |
2 |
8 |
4 |
4 |
|
SOKOLOVA Elena |
4 |
4 |
12 |
14 |
3 |
3 |
|
MANIACHENKO Galina |
5 |
5 |
6 |
10 |
7 |
6 |
|
SEBESTYEN Julia |
6 |
15 |
3 |
1 |
2 |
2 |
|
KOSTNER Carolina |
7 |
6 |
7 |
7 |
6 |
7 |
|
HEGEL Idora |
8 |
3 |
18 |
4 |
13 |
14 |
|
MEIER Sarah |
9 |
7 |
10 |
11 |
13 |
15 |
|
KETTUNEN Elina |
11 |
10 |
14 |
11 |
11 |
12 |
|
TIMOSHENKO Daria |
10 |
11 |
7 |
17 |
9 |
10 |
|
KORPI Kiira |
12 |
13 |
11 |
22 |
10 |
11 |
|
DYTRT Annette |
13 |
18 |
9 |
6 |
8 |
8 |
|
McCORKELL Jenna |
14 |
12 |
16 |
18 |
15 |
13 |
|
LUCA Roxana |
15 |
8 |
19 |
21 |
16 |
17 |
|
MAXWELL Fleur |
16 |
19 |
13 |
5 |
12 |
9 |
|
KARADEMIR Tugba |
18 |
21 |
4 |
9 |
19 |
20 |
|
JOHANSSON Lina |
17 |
14 |
23 |
16 |
18 |
18 |
|
POTH Diana |
19 |
23 |
20 |
18 |
17 |
16 |
|
RADEVA Sonia |
20 |
20 |
15 |
11 |
20 |
19 |
|
VENHUIZEN Karen |
21 |
17 |
17 |
15 |
23 |
23 |
|
DIDIER Candice |
22 |
16 |
24 |
23 |
22 |
22 |
|
KREUZER Andrea |
23 |
24 |
21 |
20 |
21 |
21 |
|
PADAR Bianka |
24 |
22 |
22 |
24 |
24 |
24 |
Next we look at the placement and points each skater received from each judge. Notice the variety among the point totals from judge to judge, and the fact there is as much variety among the placements in the new system as there ever was in the former system. There has been no change in that regard, and over many competitions it appears there is more spread in the new system than in the old. This says there there is a lot of "noise" in the system. Also note that under the majority principle Poykio would place ahead of Liashenko.
|
J1 |
J2 |
J3 |
J4 |
J5 |
J6 |
J7 |
J8 |
J9 |
J10 |
J11 |
J12 |
|
|
SLUTSKAYA Irina |
2 |
1 |
3 |
2 |
3 |
1 |
3 |
2 |
5 |
2 |
1 |
1 |
|
99.90 |
107.10 |
99.50 |
102.00 |
100.40 |
107.00 |
108.30 |
101.00 |
96.60 |
101.80 |
108.90 |
110.40 |
|
|
LIASHENKO Elena |
1 |
2 |
1 |
3 |
2 |
3 |
2 |
6 |
1 |
3 |
2 |
3 |
|
101.50 |
105.20 |
101.60 |
101.60 |
102.20 |
104.00 |
109.10 |
94.50 |
106.50 |
99.60 |
105.80 |
100.60 |
|
|
POYKIO Susanna |
4 |
3 |
2 |
1 |
1 |
2 |
5 |
1 |
3 |
1 |
3 |
2 |
|
96.30 |
102.40 |
101.30 |
102.40 |
105.70 |
106.60 |
101.60 |
102.00 |
97.70 |
107.50 |
104.80 |
103.50 |
|
|
SOKOLOVA Elena |
5 |
4 |
5 |
5 |
5 |
7 |
1 |
3 |
2 |
4 |
4 |
4 |
|
93.40 |
99.00 |
92.20 |
95.50 |
95.50 |
96.90 |
111.30 |
99.80 |
102.60 |
98.00 |
102.70 |
99.90 |
|
|
MANIACHENKO Galina |
3 |
6 |
6 |
5 |
4 |
6 |
4 |
4 |
4 |
8 |
6 |
6 |
|
98.10 |
96.60 |
90.70 |
95.50 |
96.10 |
98.90 |
101.70 |
96.20 |
97.00 |
88.30 |
94.80 |
97.80 |
|
|
SEBESTYEN Julia |
6 |
7 |
8 |
4 |
7 |
5 |
7 |
7 |
6 |
5 |
7 |
5 |
|
93.20 |
94.00 |
89.00 |
100.70 |
92.70 |
99.00 |
95.90 |
94.10 |
94.30 |
95.30 |
94.00 |
98.20 |
|
|
KOSTNER Carolina |
9 |
5 |
4 |
7 |
6 |
4 |
6 |
5 |
7 |
7 |
5 |
7 |
|
85.70 |
97.90 |
95.70 |
92.20 |
94.40 |
99.40 |
98.60 |
95.10 |
91.00 |
89.50 |
95.20 |
94.30 |
|
|
HEGEL Idora |
8 |
8 |
9 |
9 |
8 |
9 |
8 |
8 |
9 |
6 |
9 |
8 |
|
87.90 |
93.50 |
84.30 |
85.50 |
89.50 |
87.50 |
94.50 |
89.90 |
84.90 |
90.20 |
88.00 |
89.10 |
|
|
MEIER Sarah |
11 |
10 |
7 |
8 |
10 |
8 |
9 |
11 |
8 |
13 |
9 |
9 |
|
81.40 |
89.80 |
90.00 |
87.80 |
84.50 |
89.90 |
92.70 |
87.00 |
87.30 |
81.00 |
88.00 |
88.30 |
|
|
KETTUNEN Elina |
13 |
12 |
12 |
9 |
11 |
10 |
13 |
9 |
10 |
9 |
11 |
12 |
|
77.90 |
86.00 |
81.70 |
85.50 |
84.20 |
85.80 |
81.30 |
89.00 |
83.50 |
84.60 |
82.90 |
83.20 |
|
|
TIMOSHENKO Daria |
7 |
9 |
11 |
11 |
9 |
15 |
10 |
9 |
12 |
14 |
8 |
12 |
|
88.60 |
91.50 |
82.10 |
80.40 |
88.80 |
76.40 |
90.80 |
89.00 |
81.50 |
78.00 |
88.40 |
83.20 |
|
|
KORPI Kiira |
14 |
13 |
10 |
12 |
12 |
13 |
14 |
12 |
13 |
11 |
12 |
10 |
|
76.30 |
83.40 |
82.50 |
80.30 |
80.90 |
80.30 |
81.20 |
83.20 |
79.60 |
81.40 |
81.10 |
84.40 |
|
|
DYTRT Annette |
10 |
15 |
15 |
16 |
13 |
12 |
15 |
13 |
11 |
10 |
16 |
11 |
|
82.20 |
79.70 |
77.60 |
75.90 |
79.60 |
81.70 |
80.40 |
82.20 |
81.90 |
83.10 |
75.20 |
83.70 |
|
|
McCORKELL Jenna |
16 |
14 |
13 |
13 |
15 |
11 |
12 |
14 |
14 |
15 |
14 |
14 |
|
74.80 |
81.20 |
81.10 |
77.10 |
77.00 |
82.00 |
84.20 |
80.30 |
77.90 |
77.30 |
79.40 |
83.20 |
|
|
LUCA Roxana |
12 |
11 |
14 |
15 |
16 |
14 |
11 |
15 |
16 |
16 |
13 |
16 |
|
79.20 |
86.80 |
79.90 |
76.60 |
76.60 |
77.70 |
85.60 |
78.60 |
75.00 |
76.70 |
80.70 |
80.90 |
|
|
MAXWELL Fleur |
15 |
16 |
16 |
14 |
14 |
16 |
17 |
16 |
15 |
11 |
15 |
15 |
|
75.10 |
76.60 |
77.20 |
76.90 |
78.80 |
74.70 |
75.30 |
78.30 |
75.40 |
81.40 |
75.60 |
81.20 |
|
|
KARADEMIR Tugba |
18 |
17 |
17 |
17 |
18 |
17 |
18 |
19 |
19 |
21 |
17 |
18 |
|
68.20 |
70.20 |
72.70 |
72.40 |
67.70 |
72.50 |
72.80 |
68.90 |
66.80 |
62.20 |
68.50 |
71.70 |
|
|
JOHANSSON Lina |
17 |
19 |
18 |
20 |
17 |
20 |
16 |
17 |
21 |
17 |
22 |
17 |
|
73.80 |
67.60 |
69.40 |
68.50 |
69.40 |
63.20 |
76.40 |
71.80 |
66.50 |
71.60 |
64.50 |
72.40 |
|
|
POTH Diana |
22 |
18 |
19 |
18 |
19 |
21 |
21 |
20 |
18 |
19 |
21 |
20 |
|
58.90 |
69.60 |
64.90 |
70.90 |
67.40 |
62.60 |
69.30 |
66.20 |
67.80 |
66.00 |
65.70 |
66.70 |
|
|
RADEVA Sonia |
19 |
20 |
20 |
21 |
22 |
18 |
19 |
21 |
20 |
20 |
18 |
21 |
|
62.90 |
64.20 |
64.30 |
64.80 |
63.30 |
67.60 |
70.10 |
65.90 |
66.70 |
64.80 |
67.00 |
65.70 |
|
|
VENHUIZEN Karen |
19 |
21 |
21 |
19 |
21 |
22 |
20 |
18 |
17 |
22 |
19 |
19 |
|
62.90 |
60.90 |
63.80 |
70.40 |
63.50 |
57.90 |
70.00 |
70.80 |
68.00 |
60.70 |
66.40 |
68.30 |
|
|
DIDIER Candice |
21 |
23 |
22 |
22 |
20 |
19 |
22 |
22 |
22 |
18 |
20 |
22 |
|
59.70 |
58.30 |
60.70 |
63.50 |
67.30 |
64.20 |
66.60 |
65.30 |
65.80 |
69.10 |
65.80 |
62.00 |
|
|
KREUZER Andrea |
23 |
22 |
24 |
24 |
23 |
23 |
23 |
24 |
24 |
23 |
24 |
23 |
|
54.70 |
59.00 |
53.00 |
55.40 |
58.00 |
57.00 |
58.90 |
53.50 |
55.40 |
57.80 |
55.20 |
59.50 |
|
|
PADAR Bianka |
24 |
24 |
23 |
23 |
24 |
24 |
24 |
23 |
23 |
24 |
23 |
24 |
|
52.40 |
52.00 |
54.30 |
57.70 |
51.40 |
52.90 |
57.00 |
56.10 |
56.90 |
47.10 |
59.20 |
55.10 |
When broken down by skill category we find that the difference of opinion among the judges for jumping skill corresponds to about 4-6 places for each skater. Again this is a symptom of the excessive noise in the results; something that is seen in the total points table and all the other ordinal tables below.
|
J1 |
J2 |
J3 |
J4 |
J5 |
J6 |
J7 |
J8 |
J9 |
J10 |
J11 |
J12 |
|
|
SLUTSKAYA Irina |
11 |
10 |
12 |
9 |
11 |
8 |
11 |
12 |
12 |
9 |
11 |
6 |
|
LIASHENKO Elena |
1 |
1 |
1 |
1 |
1 |
2 |
1 |
1 |
1 |
2 |
1 |
4 |
|
POYKIO Susanna |
3 |
3 |
3 |
2 |
3 |
1 |
6 |
3 |
3 |
1 |
2 |
1 |
|
SOKOLOVA Elena |
6 |
4 |
8 |
6 |
5 |
5 |
3 |
4 |
2 |
4 |
3 |
5 |
|
MANIACHENKO Galina |
7 |
8 |
6 |
4 |
6 |
6 |
5 |
7 |
6 |
5 |
7 |
3 |
|
SEBESTYEN Julia |
15 |
15 |
15 |
11 |
15 |
12 |
15 |
16 |
14 |
15 |
15 |
14 |
|
KOSTNER Carolina |
9 |
6 |
5 |
6 |
7 |
4 |
7 |
6 |
7 |
7 |
5 |
7 |
|
HEGEL Idora |
2 |
2 |
2 |
5 |
2 |
3 |
2 |
5 |
5 |
3 |
4 |
2 |
|
MEIER Sarah |
4 |
4 |
4 |
3 |
4 |
7 |
4 |
2 |
4 |
6 |
6 |
9 |
|
KETTUNEN Elina |
12 |
11 |
10 |
8 |
8 |
9 |
10 |
8 |
11 |
12 |
10 |
12 |
|
TIMOSHENKO Daria |
8 |
9 |
11 |
12 |
10 |
14 |
9 |
11 |
8 |
13 |
8 |
10 |
|
KORPI Kiira |
14 |
13 |
13 |
14 |
13 |
13 |
14 |
13 |
13 |
14 |
13 |
13 |
|
DYTRT Annette |
18 |
20 |
18 |
19 |
17 |
17 |
20 |
18 |
18 |
17 |
20 |
18 |
|
McCORKELL Jenna |
13 |
12 |
9 |
13 |
12 |
11 |
12 |
10 |
9 |
10 |
12 |
11 |
|
LUCA Roxana |
5 |
7 |
7 |
10 |
9 |
10 |
8 |
9 |
10 |
8 |
9 |
8 |
|
MAXWELL Fleur |
21 |
18 |
17 |
22 |
18 |
18 |
18 |
19 |
17 |
19 |
18 |
19 |
|
KARADEMIR Tugba |
22 |
19 |
19 |
18 |
22 |
20 |
21 |
21 |
22 |
23 |
20 |
20 |
|
JOHANSSON Lina |
10 |
14 |
14 |
15 |
14 |
15 |
13 |
15 |
15 |
11 |
14 |
15 |
|
POTH Diana |
23 |
23 |
23 |
23 |
23 |
23 |
23 |
23 |
23 |
21 |
23 |
23 |
|
RADEVA Sonia |
20 |
21 |
21 |
21 |
20 |
21 |
19 |
20 |
21 |
20 |
22 |
22 |
|
VENHUIZEN Karen |
17 |
17 |
20 |
17 |
19 |
19 |
17 |
14 |
19 |
18 |
17 |
17 |
|
DIDIER Candice |
16 |
16 |
16 |
16 |
16 |
16 |
16 |
17 |
16 |
16 |
16 |
16 |
|
KREUZER Andrea |
24 |
24 |
24 |
24 |
24 |
24 |
24 |
24 |
24 |
24 |
24 |
24 |
|
PADAR Bianka |
19 |
22 |
22 |
20 |
21 |
22 |
22 |
22 |
20 |
22 |
19 |
20 |
For spins we find that the difference of opinion among the judges for this skill corresponds to about 5-8 places for each skater.
|
J1 |
J2 |
J3 |
J4 |
J5 |
J6 |
J7 |
J8 |
J9 |
J10 |
J11 |
J12 |
|
|
SLUTSKAYA Irina |
1 |
1 |
1 |
1 |
1 |
1 |
1 |
1 |
1 |
1 |
1 |
1 |
|
LIASHENKO Elena |
4 |
2 |
4 |
6 |
4 |
3 |
5 |
7 |
3 |
3 |
4 |
4 |
|
POYKIO Susanna |
5 |
3 |
2 |
5 |
2 |
6 |
2 |
7 |
2 |
2 |
3 |
2 |
|
SOKOLOVA Elena |
12 |
11 |
12 |
7 |
15 |
12 |
11 |
12 |
14 |
7 |
9 |
12 |
|
MANIACHENKO Galina |
3 |
9 |
11 |
4 |
7 |
5 |
6 |
5 |
7 |
7 |
7 |
8 |
|
SEBESTYEN Julia |
2 |
5 |
4 |
2 |
6 |
2 |
3 |
3 |
5 |
4 |
2 |
4 |
|
KOSTNER Carolina |
10 |
6 |
7 |
10 |
8 |
8 |
7 |
6 |
11 |
9 |
9 |
10 |
|
HEGEL Idora |
14 |
14 |
16 |
18 |
17 |
16 |
18 |
18 |
18 |
20 |
18 |
21 |
|
MEIER Sarah |
7 |
9 |
6 |
9 |
11 |
9 |
12 |
11 |
7 |
11 |
8 |
8 |
|
KETTUNEN Elina |
13 |
15 |
13 |
14 |
12 |
12 |
17 |
12 |
12 |
13 |
14 |
13 |
|
TIMOSHENKO Daria |
6 |
7 |
10 |
7 |
4 |
10 |
8 |
3 |
9 |
18 |
6 |
6 |
|
KORPI Kiira |
11 |
13 |
9 |
11 |
13 |
10 |
10 |
9 |
9 |
10 |
15 |
14 |
|
DYTRT Annette |
9 |
7 |
8 |
11 |
10 |
7 |
9 |
9 |
6 |
6 |
9 |
6 |
|
McCORKELL Jenna |
17 |
17 |
18 |
19 |
18 |
20 |
13 |
20 |
19 |
16 |
16 |
20 |
|
LUCA Roxana |
15 |
18 |
19 |
20 |
19 |
18 |
19 |
12 |
20 |
21 |
19 |
18 |
|
MAXWELL Fleur |
17 |
12 |
16 |
15 |
9 |
16 |
16 |
18 |
13 |
12 |
13 |
11 |
|
KARADEMIR Tugba |
7 |
3 |
2 |
3 |
3 |
4 |
4 |
2 |
4 |
5 |
5 |
3 |
|
JOHANSSON Lina |
23 |
23 |
23 |
23 |
22 |
23 |
23 |
23 |
23 |
23 |
23 |
23 |
|
POTH Diana |
19 |
16 |
20 |
21 |
20 |
14 |
20 |
16 |
17 |
17 |
19 |
19 |
|
RADEVA Sonia |
16 |
19 |
13 |
11 |
14 |
15 |
14 |
12 |
14 |
15 |
9 |
15 |
|
VENHUIZEN Karen |
21 |
20 |
15 |
16 |
15 |
19 |
14 |
17 |
14 |
19 |
17 |
16 |
|
DIDIER Candice |
23 |
24 |
24 |
24 |
24 |
24 |
24 |
24 |
24 |
24 |
24 |
24 |
|
KREUZER Andrea |
20 |
21 |
21 |
22 |
21 |
21 |
22 |
21 |
22 |
14 |
21 |
16 |
|
PADAR Bianka |
22 |
22 |
22 |
16 |
23 |
22 |
20 |
22 |
21 |
22 |
22 |
22 |
For sequences we find that the difference of opinion among the judges for this skill corresponds to about 5-8 places for each skater. Note the large number of ties for any one judge. This is symptomatic of the fact many judges give the same GoE for nearly all sequences in an event.
|
J1 |
J2 |
J3 |
J4 |
J5 |
J6 |
J7 |
J8 |
J9 |
J10 |
J11 |
J12 |
|
|
SLUTSKAYA Irina |
1 |
1 |
1 |
8 |
5 |
1 |
2 |
1 |
7 |
5 |
1 |
2 |
|
LIASHENKO Elena |
3 |
4 |
2 |
2 |
1 |
3 |
1 |
2 |
1 |
1 |
2 |
3 |
|
POYKIO Susanna |
10 |
5 |
5 |
4 |
9 |
10 |
6 |
6 |
8 |
6 |
8 |
8 |
|
SOKOLOVA Elena |
10 |
10 |
9 |
15 |
9 |
10 |
6 |
6 |
8 |
10 |
8 |
8 |
|
MANIACHENKO Galina |
5 |
5 |
9 |
9 |
6 |
6 |
9 |
6 |
8 |
10 |
8 |
8 |
|
SEBESTYEN Julia |
2 |
2 |
2 |
1 |
1 |
2 |
3 |
2 |
1 |
1 |
2 |
1 |
|
KOSTNER Carolina |
5 |
5 |
9 |
9 |
6 |
5 |
5 |
6 |
8 |
6 |
6 |
8 |
|
HEGEL Idora |
3 |
2 |
2 |
2 |
3 |
3 |
3 |
2 |
1 |
1 |
2 |
5 |
|
MEIER Sarah |
10 |
10 |
9 |
9 |
9 |
10 |
13 |
6 |
4 |
10 |
8 |
8 |
|
KETTUNEN Elina |
10 |
10 |
9 |
9 |
9 |
10 |
13 |
6 |
8 |
9 |
8 |
8 |
|
TIMOSHENKO Daria |
17 |
16 |
17 |
16 |
16 |
16 |
15 |
17 |
16 |
16 |
16 |
17 |
|
KORPI Kiira |
17 |
16 |
17 |
16 |
18 |
16 |
20 |
17 |
16 |
21 |
16 |
22 |
|
DYTRT Annette |
5 |
5 |
5 |
4 |
6 |
6 |
6 |
5 |
4 |
6 |
6 |
7 |
|
McCORKELL Jenna |
17 |
16 |
17 |
16 |
18 |
16 |
17 |
17 |
16 |
16 |
16 |
17 |
|
LUCA Roxana |
17 |
16 |
17 |
16 |
18 |
16 |
20 |
17 |
16 |
21 |
16 |
17 |
|
MAXWELL Fleur |
5 |
5 |
5 |
4 |
4 |
6 |
9 |
16 |
4 |
4 |
5 |
4 |
|
KARADEMIR Tugba |
5 |
10 |
5 |
4 |
9 |
6 |
9 |
6 |
8 |
14 |
8 |
6 |
|
JOHANSSON Lina |
16 |
16 |
16 |
16 |
16 |
16 |
17 |
15 |
16 |
16 |
16 |
16 |
|
POTH Diana |
17 |
16 |
17 |
16 |
18 |
16 |
17 |
17 |
16 |
16 |
16 |
17 |
|
RADEVA Sonia |
10 |
10 |
9 |
9 |
9 |
10 |
9 |
6 |
8 |
10 |
8 |
8 |
|
VENHUIZEN Karen |
10 |
15 |
9 |
9 |
9 |
15 |
16 |
14 |
8 |
14 |
8 |
8 |
|
DIDIER Candice |
17 |
23 |
23 |
23 |
18 |
16 |
20 |
17 |
16 |
21 |
16 |
24 |
|
KREUZER Andrea |
17 |
16 |
17 |
16 |
18 |
16 |
20 |
17 |
16 |
20 |
16 |
17 |
|
PADAR Bianka |
24 |
23 |
23 |
23 |
24 |
24 |
20 |
24 |
16 |
24 |
24 |
22 |
For the first two program components we find that the difference of opinion among the judges also corresponds to about 5-8 places for each skater.
|
J1 |
J2 |
J3 |
J4 |
J5 |
J6 |
J7 |
J8 |
J9 |
J10 |
J11 |
J12 |
|
|
SLUTSKAYA Irina |
1 |
1 |
1 |
2 |
2 |
1 |
1 |
1 |
2 |
3 |
1 |
1 |
|
LIASHENKO Elena |
5 |
7 |
3 |
4 |
4 |
4 |
4 |
5 |
2 |
5 |
5 |
5 |
|
POYKIO Susanna |
6 |
4 |
2 |
3 |
1 |
3 |
6 |
3 |
6 |
1 |
2 |
4 |
|
SOKOLOVA Elena |
4 |
3 |
6 |
4 |
5 |
6 |
1 |
4 |
1 |
4 |
2 |
3 |
|
MANIACHENKO Galina |
3 |
6 |
7 |
7 |
7 |
6 |
7 |
5 |
5 |
10 |
6 |
8 |
|
SEBESTYEN Julia |
1 |
2 |
3 |
1 |
3 |
2 |
3 |
2 |
2 |
1 |
4 |
2 |
|
KOSTNER Carolina |
9 |
4 |
3 |
6 |
5 |
5 |
5 |
7 |
7 |
5 |
6 |
5 |
|
HEGEL Idora |
11 |
9 |
18 |
16 |
11 |
12 |
14 |
13 |
14 |
12 |
9 |
14 |
|
MEIER Sarah |
17 |
14 |
9 |
12 |
15 |
9 |
9 |
15 |
14 |
15 |
9 |
11 |
|
KETTUNEN Elina |
11 |
9 |
14 |
9 |
11 |
10 |
16 |
8 |
9 |
9 |
12 |
13 |
|
TIMOSHENKO Daria |
8 |
8 |
11 |
12 |
8 |
14 |
8 |
8 |
12 |
13 |
8 |
14 |
|
KORPI Kiira |
11 |
11 |
8 |
12 |
10 |
10 |
11 |
12 |
10 |
10 |
11 |
10 |
|
DYTRT Annette |
7 |
12 |
9 |
11 |
9 |
8 |
9 |
10 |
7 |
7 |
12 |
7 |
|
McCORKELL Jenna |
15 |
14 |
11 |
16 |
15 |
13 |
11 |
14 |
14 |
13 |
12 |
11 |
|
LUCA Roxana |
15 |
12 |
16 |
18 |
18 |
17 |
13 |
16 |
18 |
15 |
12 |
18 |
|
MAXWELL Fleur |
10 |
17 |
11 |
8 |
11 |
14 |
18 |
11 |
10 |
8 |
16 |
9 |
|
KARADEMIR Tugba |
19 |
19 |
18 |
20 |
19 |
17 |
19 |
20 |
21 |
22 |
20 |
19 |
|
JOHANSSON Lina |
11 |
18 |
15 |
15 |
15 |
21 |
14 |
16 |
18 |
15 |
18 |
16 |
|
POTH Diana |
18 |
16 |
17 |
9 |
14 |
20 |
16 |
18 |
12 |
15 |
17 |
16 |
|
RADEVA Sonia |
20 |
21 |
20 |
21 |
21 |
16 |
20 |
19 |
17 |
20 |
19 |
20 |
|
VENHUIZEN Karen |
21 |
22 |
21 |
18 |
23 |
24 |
20 |
20 |
20 |
23 |
22 |
22 |
|
DIDIER Candice |
22 |
22 |
23 |
22 |
21 |
22 |
23 |
20 |
21 |
15 |
20 |
23 |
|
KREUZER Andrea |
22 |
19 |
22 |
23 |
19 |
19 |
20 |
23 |
21 |
21 |
23 |
21 |
|
PADAR Bianka |
24 |
24 |
24 |
24 |
24 |
23 |
24 |
23 |
24 |
24 |
24 |
24 |
For the last three program components we find that the difference of opinion among the judges also corresponds to about 5-8 places for each skater, with the worst case example 15 places.
|
J1 |
J2 |
J3 |
J4 |
J5 |
J6 |
J7 |
J8 |
J9 |
J10 |
J11 |
J12 |
|
|
SLUTSKAYA Irina |
1 |
1 |
1 |
2 |
2 |
1 |
1 |
1 |
3 |
1 |
1 |
1 |
|
LIASHENKO Elena |
4 |
6 |
5 |
4 |
4 |
4 |
4 |
18 |
3 |
5 |
5 |
6 |
|
POYKIO Susanna |
6 |
2 |
2 |
3 |
1 |
3 |
6 |
4 |
6 |
1 |
4 |
4 |
|
SOKOLOVA Elena |
5 |
2 |
5 |
5 |
4 |
6 |
2 |
3 |
1 |
4 |
2 |
3 |
|
MANIACHENKO Galina |
3 |
5 |
7 |
6 |
7 |
6 |
5 |
5 |
5 |
12 |
7 |
6 |
|
SEBESTYEN Julia |
1 |
2 |
3 |
1 |
3 |
2 |
3 |
2 |
2 |
3 |
3 |
2 |
|
KOSTNER Carolina |
10 |
6 |
3 |
6 |
4 |
4 |
6 |
6 |
7 |
8 |
6 |
5 |
|
HEGEL Idora |
11 |
12 |
17 |
14 |
12 |
14 |
12 |
12 |
16 |
10 |
15 |
13 |
|
MEIER Sarah |
17 |
12 |
9 |
13 |
16 |
9 |
9 |
16 |
11 |
15 |
11 |
12 |
|
KETTUNEN Elina |
14 |
10 |
14 |
10 |
12 |
10 |
18 |
9 |
9 |
9 |
14 |
13 |
|
TIMOSHENKO Daria |
8 |
8 |
12 |
15 |
8 |
15 |
8 |
7 |
11 |
13 |
8 |
15 |
|
KORPI Kiira |
14 |
12 |
9 |
10 |
11 |
10 |
17 |
11 |
10 |
11 |
9 |
9 |
|
DYTRT Annette |
7 |
9 |
9 |
10 |
9 |
8 |
11 |
8 |
8 |
6 |
10 |
8 |
|
McCORKELL Jenna |
13 |
15 |
12 |
15 |
14 |
12 |
9 |
13 |
15 |
14 |
11 |
11 |
|
LUCA Roxana |
16 |
10 |
15 |
19 |
18 |
18 |
13 |
17 |
19 |
15 |
16 |
16 |
|
MAXWELL Fleur |
9 |
15 |
8 |
8 |
9 |
13 |
14 |
9 |
11 |
6 |
11 |
9 |
|
KARADEMIR Tugba |
18 |
20 |
17 |
19 |
20 |
17 |
20 |
20 |
22 |
22 |
21 |
19 |
|
JOHANSSON Lina |
12 |
19 |
16 |
17 |
16 |
21 |
15 |
14 |
17 |
15 |
19 |
18 |
|
POTH Diana |
22 |
17 |
17 |
9 |
14 |
18 |
15 |
15 |
11 |
15 |
17 |
17 |
|
RADEVA Sonia |
19 |
21 |
20 |
21 |
22 |
16 |
19 |
19 |
18 |
20 |
18 |
20 |
|
VENHUIZEN Karen |
21 |
22 |
21 |
18 |
23 |
23 |
20 |
20 |
19 |
23 |
21 |
21 |
|
DIDIER Candice |
23 |
22 |
22 |
23 |
19 |
20 |
22 |
22 |
21 |
19 |
19 |
23 |
|
KREUZER Andrea |
20 |
18 |
22 |
22 |
20 |
22 |
22 |
23 |
23 |
21 |
23 |
21 |
|
PADAR Bianka |
24 |
24 |
24 |
24 |
24 |
24 |
24 |
24 |
24 |
24 |
24 |
24 |
Overall, within each skill category the judges do not agree all that well, with opinions on where a skater places in any given skill varying by 6-8 places, and sometime by much more.
Finally, we look at the ordinals for each Program Component for each skater, from each judge. In this table, compare the five ordinals from each judge for the five components. You will see that while opinions may vary considerably from judge to judge by the 5-8 places discussed above, for any one judge the five Program Component ordinals are all pretty much the same. The plus/minus 0.25-0.50 points the judges play with in the PC scores translates into only about 1 place of movement among the Program Components.
By comparing the ordinals for the second Program Component to the others you also see here, that even though the Transitions marks are offset in points from the other marks to a small extent, the results for Transitions track in step with the other four components.
|
J1 |
J2 |
J3 |
J4 |
J5 |
J6 |
J7 |
J8 |
J9 |
J10 |
J11 |
J12 |
|
|
SLUTSKAYA Irina |
1 |
1 |
1 |
2 |
2 |
1 |
1 |
1 |
1 |
1 |
1 |
1 |
|
1 |
1 |
1 |
2 |
1 |
1 |
2 |
1 |
2 |
3 |
1 |
1 |
|
|
1 |
1 |
1 |
2 |
2 |
1 |
1 |
2 |
2 |
1 |
1 |
1 |
|
|
1 |
1 |
1 |
2 |
2 |
1 |
1 |
1 |
3 |
1 |
1 |
1 |
|
|
1 |
1 |
1 |
1 |
1 |
1 |
1 |
1 |
3 |
1 |
1 |
1 |
|
|
LIASHENKO Elena |
5 |
5 |
2 |
4 |
4 |
5 |
3 |
5 |
1 |
5 |
5 |
4 |
|
4 |
6 |
3 |
4 |
4 |
3 |
4 |
5 |
2 |
5 |
5 |
6 |
|
|
4 |
2 |
3 |
4 |
4 |
5 |
4 |
24 |
2 |
5 |
5 |
7 |
|
|
4 |
5 |
5 |
4 |
4 |
3 |
4 |
6 |
3 |
5 |
4 |
5 |
|
|
3 |
6 |
5 |
4 |
4 |
4 |
3 |
5 |
3 |
5 |
5 |
3 |
|
|
POYKIO Susanna |
6 |
5 |
2 |
3 |
1 |
3 |
3 |
2 |
6 |
1 |
2 |
4 |
|
6 |
2 |
2 |
3 |
1 |
3 |
7 |
3 |
6 |
1 |
2 |
4 |
|
|
4 |
2 |
2 |
2 |
1 |
3 |
6 |
5 |
5 |
1 |
3 |
3 |
|
|
6 |
2 |
2 |
3 |
1 |
3 |
6 |
3 |
7 |
1 |
4 |
4 |
|
|
5 |
2 |
2 |
3 |
1 |
5 |
5 |
2 |
5 |
1 |
4 |
3 |
|
|
SOKOLOVA Elena |
3 |
3 |
2 |
4 |
5 |
5 |
2 |
4 |
1 |
4 |
2 |
3 |
|
4 |
2 |
6 |
4 |
4 |
6 |
1 |
4 |
1 |
4 |
2 |
2 |
|
|
4 |
2 |
3 |
5 |
4 |
5 |
2 |
3 |
1 |
4 |
2 |
3 |
|
|
4 |
2 |
5 |
4 |
4 |
5 |
2 |
3 |
1 |
4 |
2 |
3 |
|
|
6 |
2 |
5 |
4 |
4 |
5 |
2 |
2 |
1 |
4 |
2 |
3 |
|
|
MANIACHENKO Galina |
3 |
7 |
7 |
7 |
7 |
7 |
7 |
5 |
5 |
8 |
6 |
7 |
|
3 |
2 |
7 |
6 |
4 |
5 |
4 |
5 |
5 |
11 |
6 |
6 |
|
|
3 |
2 |
7 |
6 |
7 |
5 |
4 |
3 |
5 |
12 |
7 |
5 |
|
|
3 |
5 |
7 |
6 |
4 |
5 |
4 |
5 |
5 |
12 |
6 |
5 |
|
|
3 |
2 |
7 |
6 |
7 |
5 |
5 |
5 |
5 |
9 |
6 |
7 |
|
|
SEBESTYEN Julia |
1 |
2 |
2 |
1 |
2 |
2 |
3 |
2 |
1 |
1 |
4 |
2 |
|
1 |
2 |
3 |
1 |
3 |
1 |
3 |
2 |
2 |
1 |
2 |
2 |
|
|
1 |
2 |
3 |
1 |
3 |
1 |
3 |
1 |
2 |
3 |
3 |
2 |
|
|
1 |
2 |
2 |
1 |
3 |
2 |
3 |
2 |
2 |
3 |
2 |
2 |
|
|
1 |
2 |
3 |
1 |
3 |
1 |
3 |
2 |
2 |
3 |
2 |
2 |
|
|
KOSTNER Carolina |
9 |
3 |
2 |
6 |
5 |
3 |
6 |
5 |
7 |
5 |
6 |
4 |
|
8 |
6 |
3 |
6 |
4 |
6 |
4 |
9 |
7 |
5 |
6 |
6 |
|
|
9 |
2 |
3 |
6 |
4 |
4 |
6 |
6 |
7 |
8 |
5 |
5 |
|
|
9 |
5 |
2 |
6 |
4 |
7 |
6 |
7 |
6 |
8 |
6 |
5 |
|
|
10 |
6 |
3 |
6 |
4 |
3 |
5 |
7 |
7 |
6 |
6 |
3 |
|
|
HEGEL Idora |
13 |
9 |
18 |
14 |
12 |
13 |
13 |
12 |
14 |
11 |
8 |
14 |
|
11 |
10 |
17 |
16 |
10 |
9 |
14 |
13 |
12 |
11 |
10 |
14 |
|
|
11 |
9 |
15 |
11 |
12 |
12 |
10 |
11 |
11 |
10 |
15 |
14 |
|
|
11 |
12 |
17 |
16 |
13 |
12 |
9 |
14 |
16 |
8 |
9 |
12 |
|
|
11 |
10 |
16 |
11 |
10 |
14 |
12 |
13 |
11 |
9 |
15 |
14 |
|
|
MEIER Sarah |
18 |
13 |
9 |
10 |
15 |
8 |
9 |
15 |
14 |
15 |
10 |
9 |
|
15 |
12 |
9 |
11 |
15 |
9 |
8 |
13 |
12 |
15 |
9 |
12 |
|
|
15 |
9 |
9 |
11 |
14 |
9 |
9 |
15 |
11 |
16 |
10 |
12 |
|
|
16 |
12 |
8 |
11 |
15 |
8 |
9 |
16 |
10 |
15 |
9 |
12 |
|
|
18 |
10 |
9 |
11 |
17 |
9 |
11 |
16 |
11 |
13 |
13 |
12 |
|
|
KETTUNEN Elina |
10 |
9 |
11 |
8 |
10 |
10 |
16 |
8 |
9 |
8 |
10 |
12 |
|
13 |
10 |
14 |
11 |
13 |
9 |
16 |
5 |
9 |
9 |
12 |
12 |
|
|
15 |
9 |
13 |
9 |
12 |
9 |
15 |
9 |
9 |
9 |
10 |
12 |
|
|
13 |
9 |
13 |
11 |
10 |
10 |
18 |
10 |
9 |
8 |
13 |
14 |
|
|
14 |
10 |
14 |
11 |
12 |
13 |
16 |
8 |
9 |
9 |
13 |
14 |
|
|
TIMOSHENKO Daria |
6 |
8 |
11 |
10 |
8 |
14 |
8 |
8 |
10 |
13 |
8 |
14 |
|
8 |
8 |
9 |
11 |
8 |
14 |
8 |
5 |
12 |
13 |
8 |
14 |
|
|
8 |
8 |
13 |
11 |
8 |
15 |
8 |
6 |
11 |
13 |
8 |
14 |
|
|
7 |
5 |
8 |
11 |
8 |
17 |
8 |
7 |
10 |
13 |
8 |
15 |
|
|
8 |
6 |
9 |
15 |
8 |
14 |
8 |
9 |
11 |
13 |
8 |
12 |
|
|
KORPI Kiira |
10 |
13 |
8 |
10 |
10 |
10 |
9 |
12 |
10 |
11 |
10 |
9 |
|
13 |
9 |
8 |
11 |
10 |
9 |
11 |
11 |
10 |
9 |
10 |
10 |
|
|
12 |
9 |
9 |
11 |
11 |
12 |
15 |
11 |
11 |
10 |
8 |
8 |
|
|
13 |
12 |
8 |
8 |
10 |
10 |
16 |
12 |
10 |
8 |
9 |
10 |
|
|
15 |
10 |
9 |
11 |
12 |
9 |
16 |
9 |
9 |
12 |
8 |
9 |
|
|
DYTRT Annette |
6 |
9 |
9 |
14 |
8 |
8 |
9 |
10 |
7 |
7 |
10 |
7 |
|
7 |
12 |
9 |
8 |
9 |
8 |
8 |
9 |
7 |
5 |
12 |
4 |
|
|
7 |
9 |
9 |
11 |
8 |
8 |
10 |
6 |
8 |
5 |
10 |
8 |
|
|
7 |
9 |
8 |
11 |
10 |
9 |
13 |
10 |
8 |
6 |
9 |
8 |
|
|
6 |
9 |
9 |
10 |
9 |
8 |
8 |
9 |
8 |
6 |
8 |
7 |
|
|
McCORKELL Jenna |
13 |
13 |
11 |
14 |
15 |
10 |
9 |
12 |
14 |
13 |
10 |
12 |
|
15 |
12 |
9 |
16 |
15 |
14 |
11 |
16 |
12 |
13 |
12 |
11 |
|
|
12 |
9 |
9 |
11 |
14 |
9 |
10 |
13 |
11 |
13 |
10 |
10 |
|
|
13 |
15 |
13 |
11 |
13 |
12 |
9 |
12 |
14 |
15 |
13 |
10 |
|
|
13 |
16 |
9 |
15 |
15 |
9 |
8 |
14 |
11 |
13 |
8 |
9 |
|
|
LUCA Roxana |
13 |
9 |
15 |
18 |
18 |
14 |
13 |
15 |
17 |
15 |
10 |
17 |
|
15 |
12 |
16 |
18 |
18 |
18 |
11 |
16 |
18 |
15 |
12 |
17 |
|
|
15 |
9 |
15 |
18 |
17 |
16 |
13 |
15 |
18 |
16 |
15 |
17 |
|
|
16 |
9 |
15 |
17 |
18 |
20 |
9 |
16 |
18 |
15 |
16 |
15 |
|
|
15 |
10 |
15 |
19 |
17 |
18 |
12 |
18 |
18 |
13 |
15 |
16 |
|
|
MAXWELL Fleur |
10 |
17 |
11 |
8 |
12 |
16 |
16 |
10 |
10 |
8 |
16 |
9 |
|
10 |
16 |
9 |
8 |
10 |
9 |
18 |
11 |
10 |
8 |
12 |
6 |
|
|
9 |
16 |
8 |
8 |
8 |
12 |
13 |
9 |
9 |
5 |
10 |
10 |
|
|
9 |
15 |
8 |
8 |
9 |
12 |
13 |
7 |
14 |
6 |
13 |
8 |
|
|
8 |
10 |
7 |
8 |
10 |
9 |
16 |
9 |
11 |
6 |
8 |
9 |
|
|
KARADEMIR Tugba |
18 |
19 |
18 |
18 |
18 |
18 |
19 |
22 |
21 |
22 |
21 |
17 |
|
18 |
19 |
17 |
20 |
19 |
14 |
19 |
19 |
21 |
22 |
18 |
20 |
|
|
18 |
20 |
15 |
18 |
20 |
16 |
21 |
18 |
22 |
22 |
19 |
19 |
|
|
19 |
19 |
17 |
17 |
20 |
17 |
20 |
20 |
22 |
22 |
22 |
19 |
|
|
15 |
19 |
16 |
19 |
19 |
16 |
19 |
20 |
21 |
22 |
19 |
17 |
|
|
JOHANSSON Lina |
13 |
18 |
15 |
14 |
15 |
21 |
13 |
17 |
17 |
15 |
18 |
14 |
|
11 |
18 |
14 |
11 |
15 |
20 |
14 |
13 |
18 |
15 |
18 |
17 |
|
|
12 |
18 |
15 |
17 |
17 |
19 |
15 |
15 |
17 |
16 |
19 |
17 |
|
|
12 |
19 |
15 |
17 |
15 |
22 |
16 |
14 |
16 |
13 |
19 |
17 |
|
|
11 |
19 |
16 |
17 |
15 |
18 |
12 |
14 |
18 |
18 |
19 |
17 |
|
|
POTH Diana |
17 |
13 |
15 |
10 |
14 |
18 |
16 |
17 |
10 |
15 |
16 |
17 |
|
18 |
16 |
17 |
8 |
13 |
20 |
16 |
18 |
12 |
15 |
17 |
14 |
|
|
21 |
16 |
15 |
9 |
14 |
19 |
18 |
13 |
11 |
13 |
15 |
14 |
|
|
22 |
15 |
17 |
8 |
15 |
15 |
13 |
16 |
10 |
18 |
16 |
17 |
|
|
22 |
16 |
16 |
8 |
12 |
21 |
12 |
16 |
11 |
13 |
17 |
17 |
|
|
RADEVA Sonia |
20 |
19 |
20 |
21 |
21 |
16 |
20 |
19 |
17 |
20 |
19 |
20 |
|
20 |
21 |
20 |
21 |
19 |
14 |
19 |
19 |
17 |
20 |
18 |
17 |
|
|
19 |
20 |
20 |
21 |
20 |
16 |
18 |
18 |
18 |
16 |
18 |
21 |
|
|
16 |
19 |
20 |
21 |
20 |
15 |
18 |
20 |
18 |
21 |
16 |
19 |
|
|
18 |
21 |
20 |
21 |
22 |
16 |
19 |
19 |
17 |
18 |
18 |
20 |
|
|
VENHUIZEN Karen |
21 |
22 |
21 |
18 |
23 |
24 |
20 |
19 |
20 |
23 |
23 |
22 |
|
20 |
22 |
21 |
18 |
23 |
23 |
19 |
21 |
18 |
23 |
18 |
20 |
|
|
21 |
22 |
21 |
18 |
20 |
23 |
18 |
21 |
18 |
23 |
23 |
22 |
|
|
22 |
22 |
21 |
17 |
23 |
23 |
21 |
19 |
18 |
23 |
19 |
19 |
|
|
21 |
22 |
21 |
17 |
22 |
23 |
19 |
20 |
18 |
22 |
19 |
20 |
|
|
DIDIER Candice |
21 |
22 |
21 |
22 |
21 |
22 |
20 |
19 |
21 |
15 |
19 |
23 |
|
22 |
22 |
23 |
22 |
19 |
22 |
23 |
21 |
21 |
15 |
22 |
23 |
|
|
23 |
22 |
22 |
22 |
19 |
19 |
22 |
18 |
18 |
16 |
19 |
23 |
|
|
21 |
22 |
22 |
23 |
18 |
20 |
21 |
20 |
18 |
18 |
19 |
23 |
|
|
22 |
22 |
22 |
23 |
19 |
18 |
22 |
22 |
21 |
18 |
19 |
23 |
|
|
KREUZER Andrea |
21 |
19 |
21 |
22 |
18 |
18 |
20 |
23 |
21 |
21 |
21 |
20 |
|
22 |
19 |
22 |
23 |
19 |
18 |
19 |
23 |
21 |
21 |
24 |
20 |
|
|
19 |
18 |
22 |
22 |
20 |
22 |
22 |
22 |
22 |
21 |
19 |
19 |
|
|
19 |
18 |
22 |
21 |
20 |
17 |
21 |
20 |
23 |
18 |
22 |
22 |
|
|
18 |
18 |
22 |
21 |
19 |
21 |
22 |
22 |
23 |
21 |
23 |
22 |
|
|
PADAR Bianka |
24 |
24 |
24 |
24 |
24 |
23 |
24 |
23 |
24 |
24 |
24 |
24 |
|
24 |
24 |
23 |
23 |
24 |
23 |
24 |
23 |
24 |
24 |
22 |
24 |
|
|
24 |
24 |
24 |
24 |
24 |
23 |
24 |
22 |
24 |
24 |
23 |
23 |
|
|
24 |
24 |
22 |
24 |
24 |
23 |
24 |
24 |
24 |
24 |
22 |
24 |
|
|
24 |
24 |
22 |
24 |
24 |
24 |
24 |
24 |
24 |
24 |
23 |
24 |
Using our standard algorithm for evaluating judging anomalies we find the following anomaly fraction for the judges in the Ladies event. (In each column, the value for the Sort Program and Free Skating are likely not for the same person due to the random order in publication of the marks.)
ANOMALY FRACTION FOR LADIES EVENT
| J1 | J2 | J3 | J4 | J5 | J6 | JJ7 | J8 | J9 | J10 | J11 | J12 | |
| SP | 29.3% | 14.4% | 23.9% | 31.0% | 20.7% | 35.5% | 30.4% | 16.6% | 40.1% | 24.9% | 21.3% | 23.8% |
| FS | 23.5% | 16.3% | 6.6% | 11.4% | 8.1% | 15.6% | 34.0% | 14.2% | 12.4% | 39.6% | 7.6% | 12.7% |
Of the 24 sets of marks we consider the quality of 8 sets good, 10 sets adequate and 6 inadequate when evaluated for the presence of anomalous marking. The average anomaly score was 21% for all 24 sets of marks. For the Short Program, the average score was 26% and for the Free Skating 17%. Many of the statistical properties of marks improve in the Free Skating segment of an event compared to the Short Program Segment, as seen here. This is just one example. We interpret this effect as being due to the use of the start order in the Free Skating as a crutch to guide the marks compared to the Short Program where the skaters compete in a fully random order.
Marks from the ladies event at the 2005 European Championships have the following mathematical properties.
Copyright 2005 by George S. Rossano